Inserting error bars in Google Sheets is fairly simple to do and you can customize them to suit your needs. Here’s how to add them to your spreadsheet.
How to Insert a Column Chart in Google Sheets
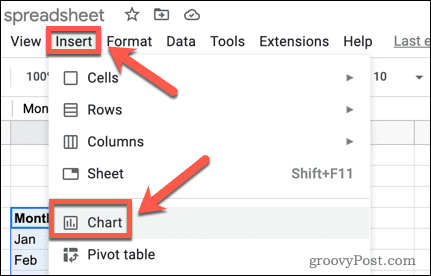
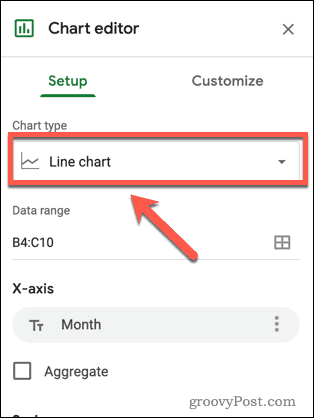
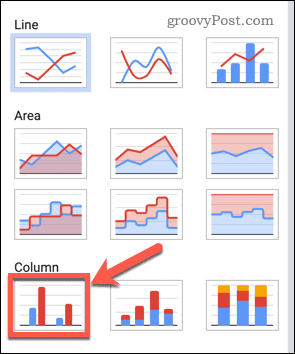
Before you can add error bars to a chart, you’ll need to add your chart in the first place. Adding a column chart takes just a few clicks. To insert a column chart in Google Sheets:
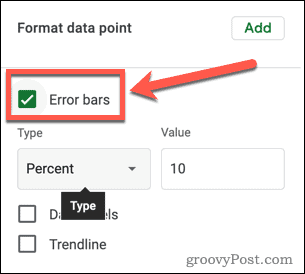
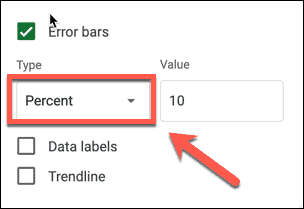
How to Add Error Bars in Google Sheets
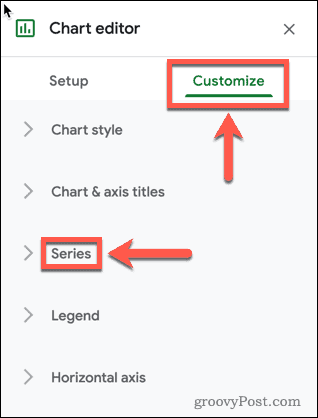
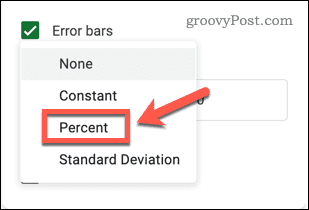
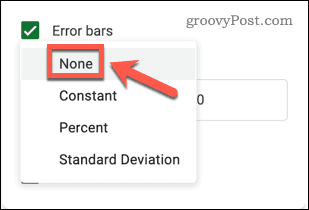
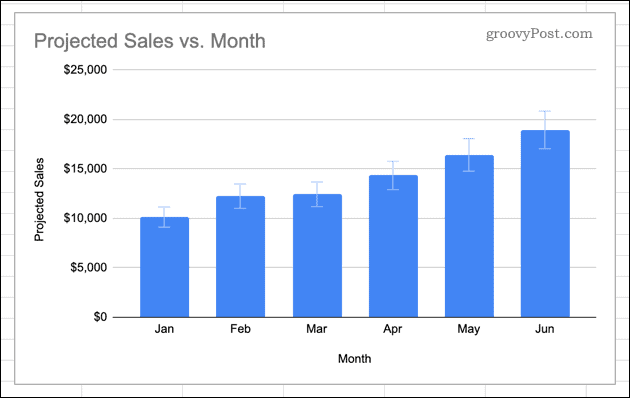
Now that you have your column chart, you can add error bars to it. There are a number of different types of error bars you can choose from in Google Sheets. To add error bars in Google Sheets:
Using Charts in Google Sheets
Knowing how to add error bars in Google Sheets allows you to show a margin of error in your figures. Adding error bars is just one way to create and customize charts in Google Sheets. If you don’t want to use an entire chart, you can insert and customize sparklines in Google Sheets to give a simple visual indication of trends in your data. If you create a chart that you want to share with the world, you can embed a Google Sheet on a website to show it off. Comment Name * Email *
Δ Save my name and email and send me emails as new comments are made to this post.


![]()
